Team Defense Impact
ℹ️ Warning
Take with a grain of salt. I’m naively looking at some statistics I found interesting on Pro Football Reference (PFR)
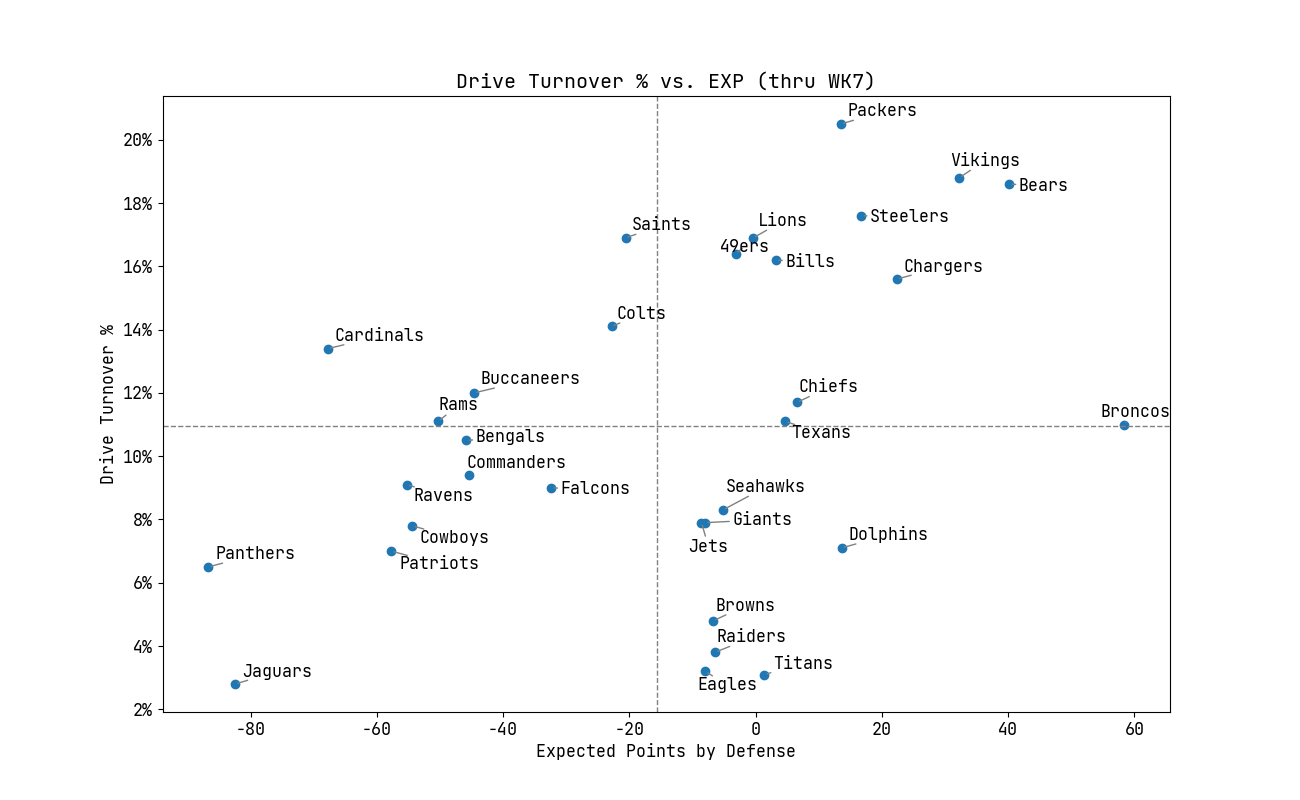
On PFR there is a statistic called EXP (Expected points contributed by all defense). I am unsure if this is using the same calculation as referred to in an ESPN article. Regardless, I thought it would be an interesting measure to compare between teams, along with another statistic: TO% (Percentage of drives resulting in a turnover).
I created a simple scatter plot to show these two statistics, and unsurprisingly the Jaguars can be found at the bottom of the pack: